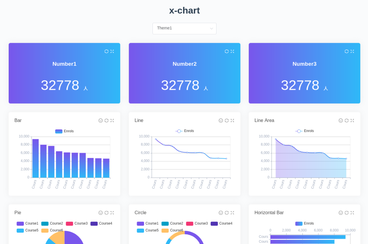
Vue.js谷歌图表(Vue.js Google Charts)
made with
Vuejs
简介及使用教程
Vue.js Google Charts是一个Google Charts库的Vue.js包装。有了vue-google-charts程序包,您无需手动加载Google Charts程序包。另一个好处是Reactive数据绑定,一旦更改了数据,类型和选项属性,图表将自动重绘。
安装
Npm
npm i vue-google-charts
Yarn
yarn add vue-google-charts
浏览器
<script src="vue.js"></script>
<script src="vue-google-charts/dist/vue-google-charts.browser.js"></script>
使用
全局导入
import Vue from 'vue'
import VueGoogleCharts from 'vue-google-charts'

Vue.use(VueGoogleCharts)
组件中使用
import { GChart } from 'vue-google-charts'

export default {
  components: {
    GChart
  }
}
示例
 <GChart
    type="ColumnChart"
    :data="chartData"
    :options="chartOptions"
  />

//...

export default {
  data () {
    return {
      // Array will be automatically processed with visualization.arrayToDataTable function
      chartData: [
        ['Year', 'Sales', 'Expenses', 'Profit'],
        ['2014', 1000, 400, 200],
        ['2015', 1170, 460, 250],
        ['2016', 660, 1120, 300],
        ['2017', 1030, 540, 350]
      ],
      chartOptions: {
        chart: {
          title: 'Company Performance',
          subtitle: 'Sales, Expenses, and Profit: 2014-2017',
        }
      }
    }
  }
}

作者
Devstark

相关项目