Frappe Charts
made with
Node.js
简介及使用教程
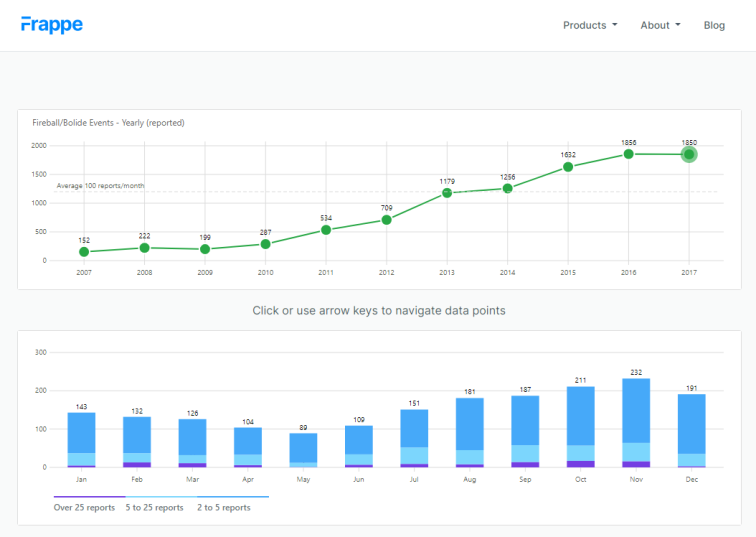
Frappe Charts是也给现代的开源SVG图表组件,基于GitHub的灵感启发,简洁、零依赖。
安装
Npm
npm i frappe-charts
Yarn
yarn add frappe-charts
浏览器
 <script src="https://cdn.jsdelivr.net/npm/frappe-charts@1.1.0/dist/frappe-charts.min.iife.js"></script>
  <!-- or -->
  <script src="https://unpkg.com/frappe-charts@1.1.0/dist/frappe-charts.min.iife.js"></script>
使用
引入
import { Chart } from "frappe-charts"

//或者es模块(如 vuejs)
import { Chart } from 'frappe-charts/dist/frappe-charts.esm.js'
// import css
import 'frappe-charts/dist/frappe-charts.min.css'
const data = {
    labels: ["12am-3am", "3am-6pm", "6am-9am", "9am-12am",
        "12pm-3pm", "3pm-6pm", "6pm-9pm", "9am-12am"
    ],
    datasets: [
        {
            name: "Some Data", type: "bar",
            values: [25, 40, 30, 35, 8, 52, 17, -4]
        },
        {
            name: "Another Set", type: "line",
            values: [25, 50, -10, 15, 18, 32, 27, 14]
        }
    ]
}

const chart = new frappe.Chart("#chart", {  // or a DOM element,
                                            // new Chart() in case of ES6 module with above usage
    title: "My Awesome Chart",
    data: data,
    type: 'axis-mixed', // or 'bar', 'line', 'scatter', 'pie', 'percentage'
    height: 250,
    colors: ['#7cd6fd', '#743ee2']
})
es模块中,需要这样使用:
- const chart = new frappe.Chart("#chart", {
+ const chart = new Chart("#chart", {  // or a DOM element,
                                    // new Chart() in case of ES6 module with above usage
    title: "My Awesome Chart",
    data: data,
    type: 'axis-mixed', // or 'bar', 'line', 'scatter', 'pie', 'percentage'
    height: 250,
    colors: ['#7cd6fd', '#743ee2']
})
示例

作者
Frappe
相关项目
没有更多信息
我要推荐一个