relation-graph
made with
Vuejs
简介及使用教程
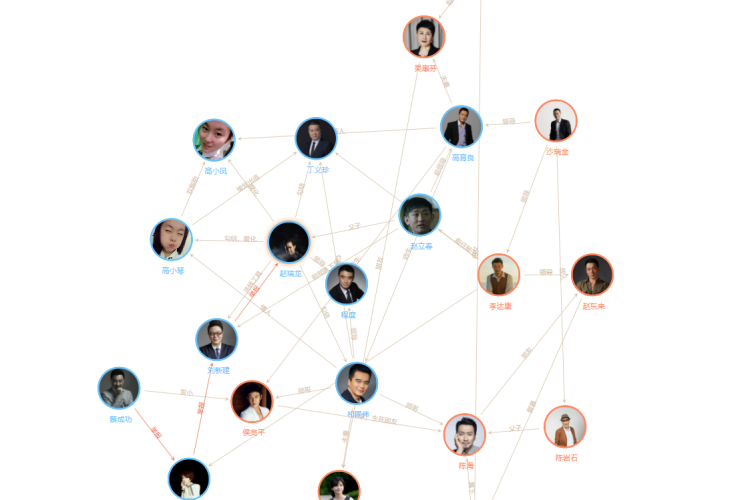
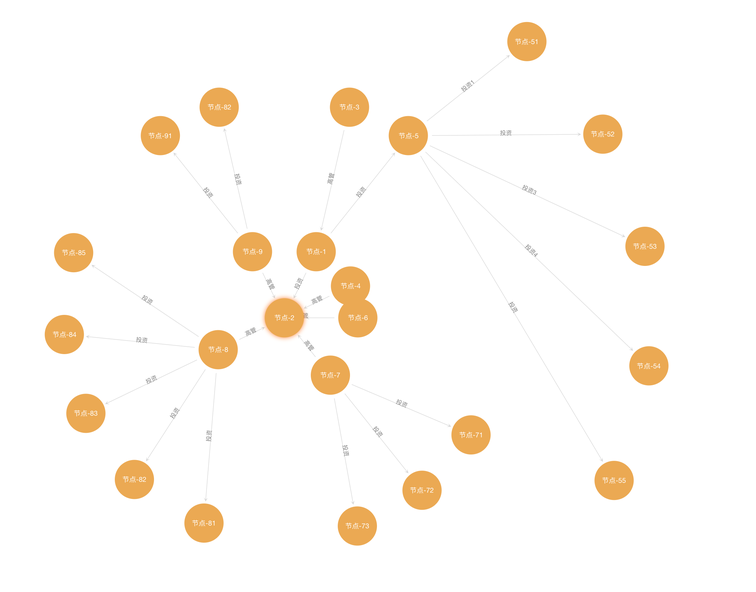
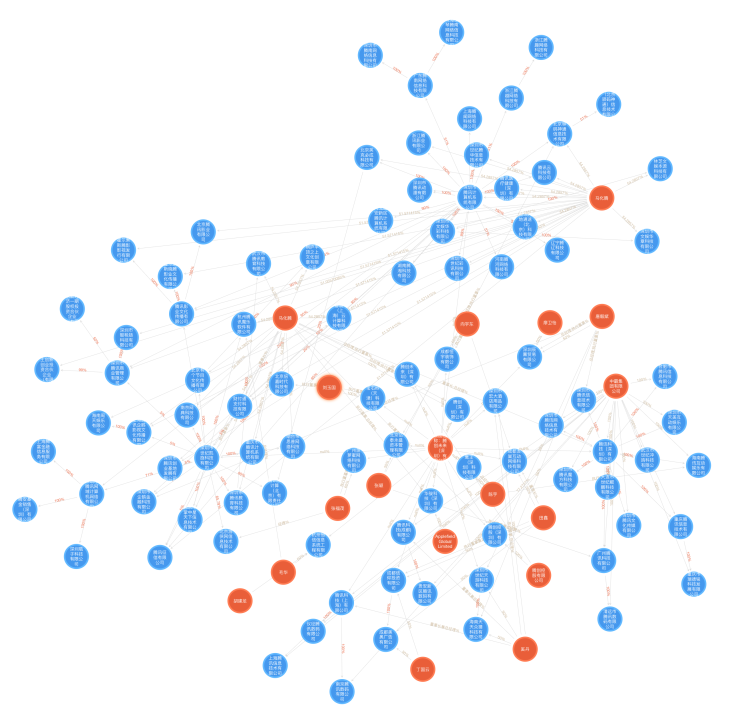
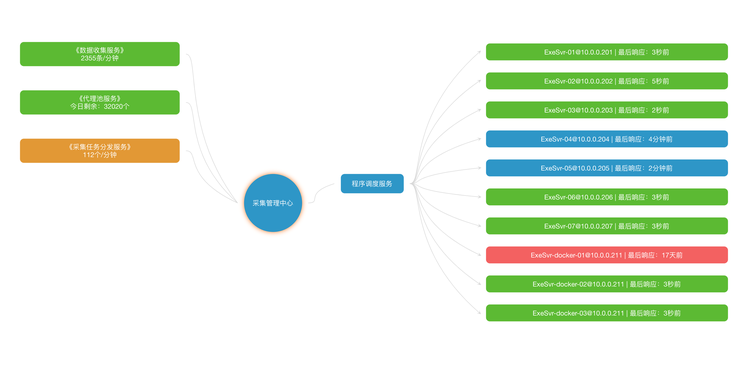
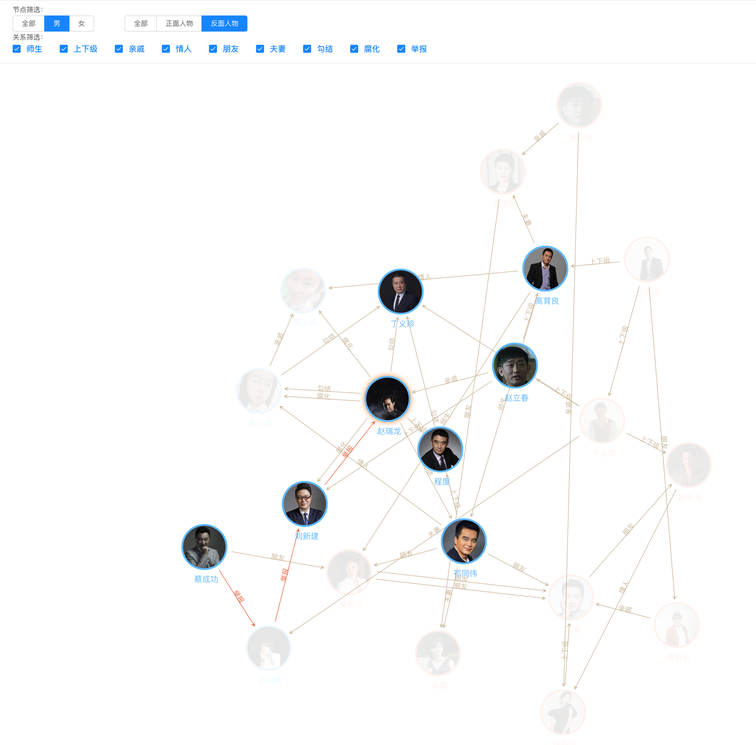
这是一个Vue关系图谱组件,可以展示如组织机构图谱、股权架构图谱、集团关系图谱等知识图谱,可提供多种图谱布局,包括树状布局、中心布局、力学布局自动布局等。
这个项目使用典型的vue编程方式,代码简单易懂。如果需要实现一些自定义的高级功能,你可以直接使用源码作为一个component放到你的项目中去用,轻松、任意的修改。
安装
Npm
npm i relation-graph
Yarn
yarn add relation-graph
浏览器
使用
<template>
   <div>
     <div style="height:calc(100vh - 50px);">
        <RelationGraph ref="seeksRelationGraph" :options="graphOptions" :on-node-click="onNodeClick" :on-line-click="onLineClick" />
     </div>
   </div>
 </template>

 <script>
 import RelationGraph from 'relation-graph'
 export default {
   name: 'Demo',
   components: { RelationGraph },
   data() {
     return {
       graphOptions: {
         allowSwitchLineShape: true,
         allowSwitchJunctionPoint: true,
         defaultJunctionPoint: 'border'
         // 这里可以参考"Graph 图谱"中的参数进行设置:http://relation-graph.com/#/docs/graph
       }
     }
   },
   mounted() {
     this.showSeeksGraph()
   },
   methods: {
     showSeeksGraph() {
       var __graph_json_data = {
         rootId: 'a',
         nodes: [
            // node配置选项:http://relation-graph.com/#/docs/node
            // node支持通过插槽slot完全自定义,示例:http://relation-graph.com/#/demo/adv-slot
           { id: 'a', text: 'A', borderColor: 'yellow' },
           { id: 'b', text: 'B', color: '#43a2f1', fontColor: 'yellow' },
           { id: 'c', text: 'C', nodeShape: 1, width: 80, height: 60 },
           { id: 'e', text: 'E', nodeShape: 0, width: 150, height: 150 }
         ],
         lines: [
            // link配置选项:http://relation-graph.com/#/docs/link
           { from: 'a', to: 'b', text: '关系1', color: '#43a2f1' },
           { from: 'a', to: 'c', text: '关系2' },
           { from: 'a', to: 'e', text: '关系3' },
           { from: 'b', to: 'e', color: '#67C23A' }
         ]
       }
       this.$refs.seeksRelationGraph.setJsonData(__graph_json_data, (seeksRGGraph) => {
         // Called when the relation-graph is completed
       })
     },
     onNodeClick(nodeObject, $event) {
       console.log('onNodeClick:', nodeObject)
     },
     onLineClick(linkObject, $event) {
       console.log('onLineClick:', linkObject)
     }
   }
 }
 </script>
图谱配置
Graph图谱
图谱的选项和事件设置方法:
<template>
   <div>
     <div style="height:calc(100vh - 50px);">
        <RelationGraph ref="seeksRelationGraph" :options="options" :on-node-click="onNodeClick" :on-line-click="onLineClick" />
     </div>
   </div>
 </template>

 <script>
...
 export default {
   name: 'Demo',
   data() {
     return {


       options: {
         allowSwitchLineShape: true,
         allowSwitchJunctionPoint: true,
         defaultJunctionPoint: 'border'
         // 这里可以参考"Graph 图谱"中的参数进行设置
       }


     }
   }
 }
 </script>
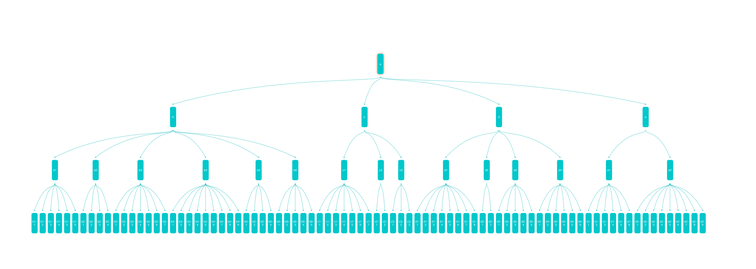
Layout布局
布局设置在这里:
<template>
   <div>
     <div style="height:calc(100vh - 50px);">
        <RelationGraph ref="seeksRelationGraph" :options="options" />
     </div>
   </div>
 </template>

 <script>
...
 export default {
   name: 'Demo',
   data() {
     return {
       options: {
         allowSwitchLineShape: true,
         allowSwitchJunctionPoint: true,
         defaultJunctionPoint: 'border',


         layouts:  [
              {
                 layoutName:  'tree',
                 layoutDirection:  'v',
                 from:  'top',
                 centerOffset_x:  0,
                 centerOffset_y:  0
              }
          ]


       }
     }
   }
 }
 </script>
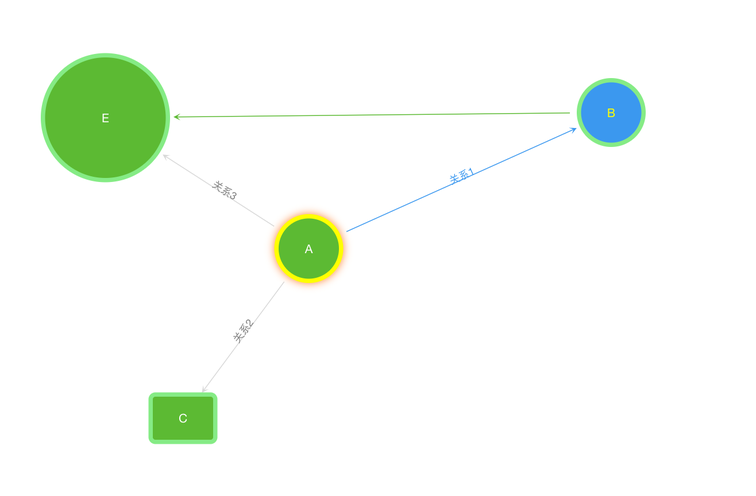
数据格式
通过设置一个json对象的nodes、lines、rootId来定义图谱中要展示的节点、关系线、根节点
 const __graph_json_data = {
         rootId: 'a',
         nodes: [
           { id: 'a', text: 'A', borderColor: 'yellow' },
           { id: 'b', text: 'B', color: '#43a2f1', fontColor: 'yellow' },
           { id: 'c', text: 'C', nodeShape: 1, width: 80, height: 60 },
           { id: 'e', text: 'E', nodeShape: 0, width: 150, height: 150 }
         ],
         lines: [
           { from: 'a', to: 'b', text: '关系1', color: '#43a2f1' },
           { from: 'a', to: 'c', text: '关系2' },
           { from: 'a', to: 'e', text: '关系3' },
           { from: 'b', to: 'e', color: '#67C23A' }
         ]
       }
示例
作者
seeksdream

相关项目